
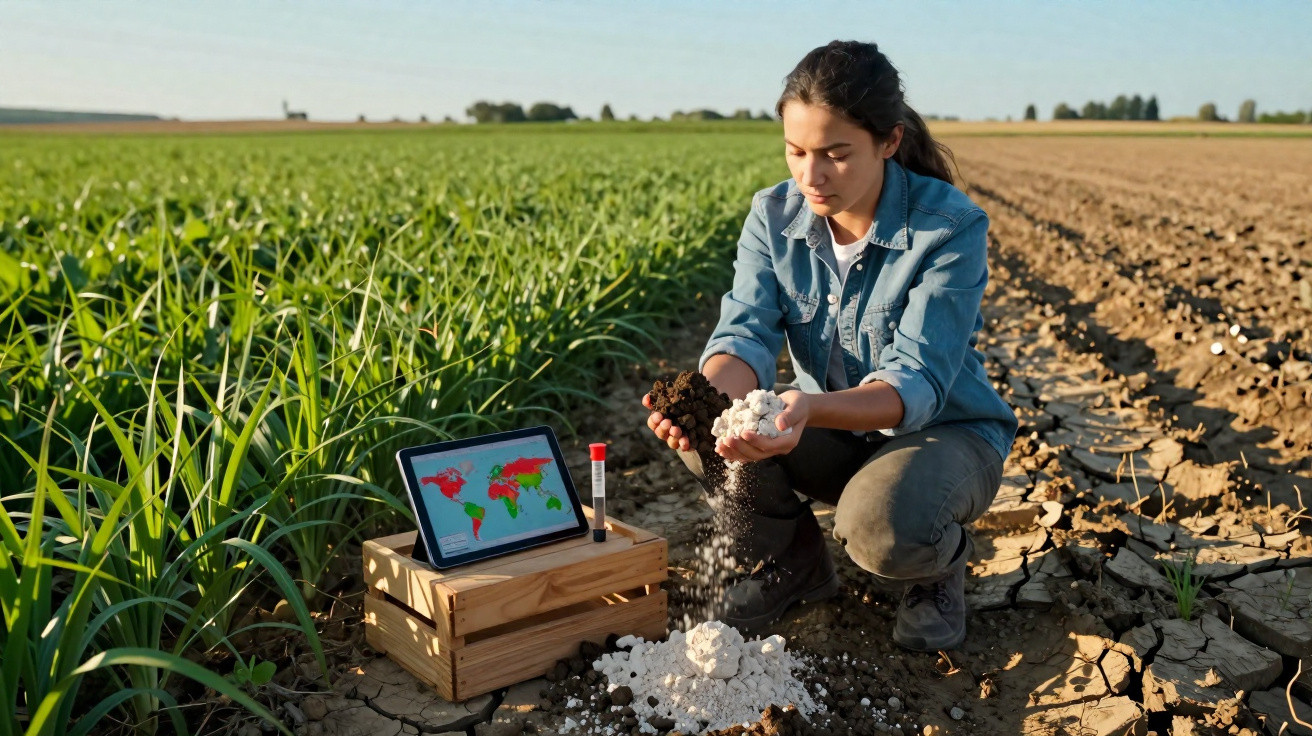
For decades, scientists have cautioned that soil degradation puts the global food supply at risk. Yet establishing precisely how much crop output it reduces has proved unexpectedly challenging.
A new worldwide study has now quantified that previously hidden cost.
The researchers calculate that reversing only 10 percent of human-driven soil degradation could generate sufficient additional food to feed more than 70 million people annually.
The results also show that the heaviest losses are not found on poor-quality farmland.
They are instead concentrated in several of the planet’s most productive farming areas.
The enduring debate over soil degradation
Soil researchers have long believed that damaged land produces less food, but demonstrating this across the world has been far more difficult.
Field experiments have repeatedly delivered conflicting findings. Some identified modest yield losses caused by erosion, while others detected no effect. A small number even recorded higher yields on degraded plots.
An experiment on one plot cannot reliably represent another soil type, climate or agricultural system. Moreover, land degradation involves much more than topsoil being washed away.
As a result, the discipline never arrived at a global estimate. Dr Hadi Hadi, a postdoctoral researcher in the Land Economics Group at the University of Bonn, aimed to address that gap.
“Now, for the first time, we’ve attempted to quantify the consequences of degradation for all the arable land around the world,” he said.
Mapping the Earth’s crop-growing potential
The researchers divided all of the world’s cropland into cells measuring roughly 10 km across, creating more than 400,000 in total.
Every cell was assigned yield data for 10 major crops, including wheat, rice, cassava and oil palm. Combined, these crops account for 83 percent of all calories produced globally.
Much of the underlying mapping was supplied by the University of Minnesota (UMN), whose scientists were co-authors of the research.
A direct comparison between cells would not have been useful, so the team matched locations with similar rainfall and temperatures.
Distinguishing soil effects from other influences
Next, the team accounted for fertiliser, irrigation, pesticides and machinery. Additional adjustments considered property rights, corruption and agriculture’s proportion of the economy.
This left a yield gap for each cell: the difference between its local harvest and the highest output actually achieved on comparable land.
“Thus, these areas give us a benchmark for what’s possible in soils that haven’t been degraded or influenced in any way,” said David Wuepper, who heads the Land Economics Group.
The researchers compared those gaps against five indicators of damage. Soil erosion and compaction caused by heavy machinery headed the list.
The other measures were soil carbon depletion, drier land and reduced tree cover.
Each indicator was assessed as a debt relative to an estimate of how that same land had been before humans began farming it.
Quantifying the cost of soil degradation
At first, the unadjusted data appeared to show the reverse of what might be expected. More degraded cells generally had higher, rather than lower, yields.
This is because damage is associated with intensive agriculture. Land worked most heavily is often both highly productive and severely worn.
The underlying pattern emerged only once the researchers controlled for climate, soil type, topography, agricultural inputs and economic conditions. A 10 percent increase in degradation was associated with a yield gap roughly 2 percent larger.
“Conversely, if we could reduce degradation by 10 percent all over the world, crop yields would grow by such an extent that we’d be able to feed over 70 million more people,” said Hadi.
Compaction caused by agricultural machinery showed the clearest association, narrowly ahead of erosion. Reduced tree cover and drier soils came next, whereas carbon depletion had little impact.
Across global cropland, a 10 percent deterioration results in losses of approximately 22 million tonnes of crops each year. That represents 52 trillion calories and around $4 billion in agricultural revenue.
The authors describe the result as an association rather than evidence of causation. They also believe it may be a conservative estimate, since their benchmark is based on the top 5 percent of actual farms, which could already have experienced some degradation.
Productive farmland bears the greatest losses
The expectation was that poorer countries would experience the largest losses, but the map indicates otherwise. The strongest local effects are grouped in northern and southern India, north-eastern China, the American Midwest and northern Argentina.
In the most severely affected cells, a further 10 percent of degradation expands the yield gap by about 6 percent. These are not marginal areas; they rank among the most intensively cultivated places in the world.
The researchers suggest that decades of fertiliser use, irrigation and crop breeding have eliminated almost every other constraint in these fields. Soil condition is the remaining limiting factor. Once it declines, there is nothing else left to sustain yields.
A separate examination of shortages in fertiliser and machinery revealed the same vulnerability. Cutting these inputs in half had its greatest impact on the world’s high-yield breadbaskets.
Sub-Saharan Africa shows the opposite pattern. Although yield gaps are substantial there, they have only a weak relationship with historical degradation. Instead, limited fertiliser, irrigation, credit and market access suppress output.
The authors interpret this as evidence that restoration funding delivers the greatest extra grain in regions that are already highly productive. Across much of Africa, improved access to basic inputs remains more effective.
Small nations and substantial harvest losses
National totals produce two distinct rankings. India, China and the United States suffer the biggest outright food losses because they farm such large areas.
One study reported that one-third of the American Corn Belt has entirely lost its carbon-rich topsoil. That erosion is thought to have reduced yields by about 6 percent, costing farmers nearly $3 billion annually.
When assessed against each country’s own production, however, the ranking changes. Lesotho and Botswana face the greatest potential share of lost harvest, followed by small nations in drier or more mountainous areas.
The authors also stress an important qualification: food produced within national borders does not automatically remain there. These estimates concern production rather than the food that ultimately reaches people’s plates.
What soil degradation changes next
The central figure is not the study’s most significant finding. More striking is the indication that the world’s most productive farmland is also its most vulnerable.
Before this research, no one had measured the relationship between soil condition and lost harvest at a planetary scale.
There is now an estimate, which directs restoration investment towards fields where modest gains could return the largest volumes of grain.
This effort is not beginning from nothing. A recent study by the same Bonn group examined national land-use regulations and payments to farmers, finding that both have already reduced soil degradation worldwide.
“Overall, the findings show how important soil quality is to the supply of agricultural produce,” said Wuepper.
Soil degradation has traditionally been regarded as an environmental issue. This research places it on the food balance sheet, valuing its annual cost in tonnes, calories and dollars.




Comments
No comments yet. Be the first to comment!
Leave a Comment